
Special Economic Zones in the OIC Region:
Learning from Experience
82
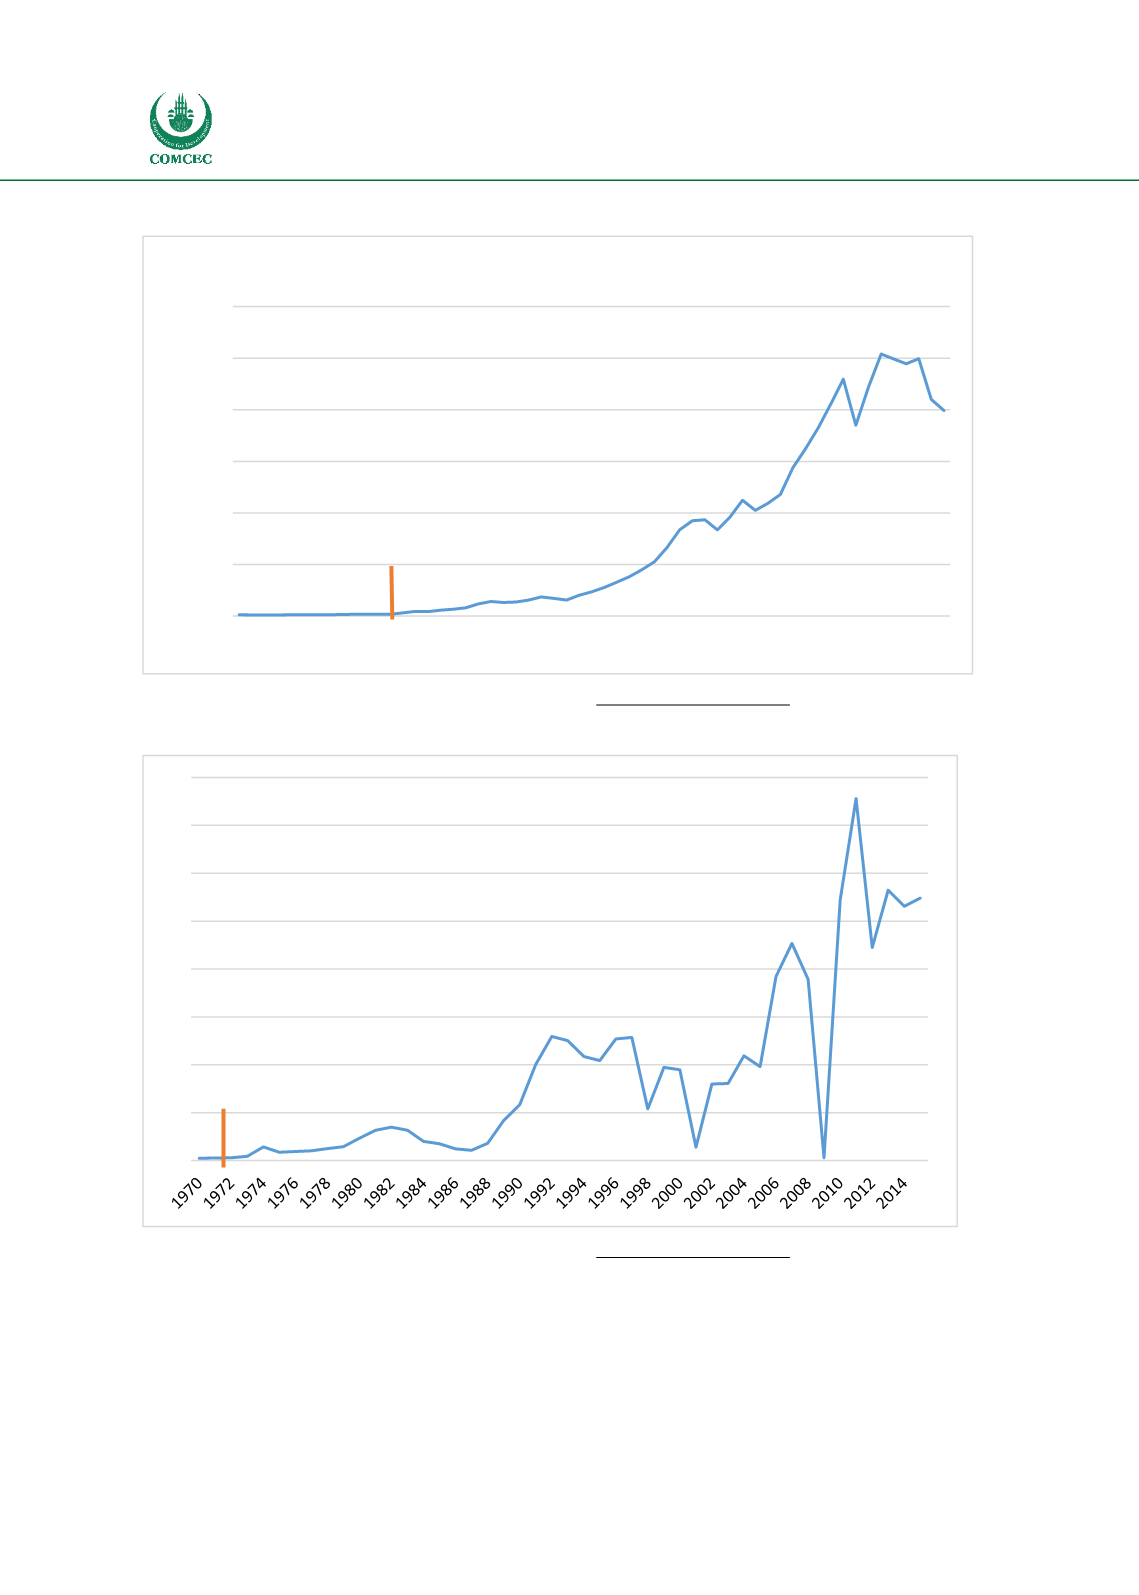
Figure 18 - Malaysian Export Values ($Bn)
Source: World Bank (2017) World Bank Open Data. Available from
: https://data.worldbank.org/Figure 19 - Malaysian FDI – Net Inflows ($Bn)
Source: World Bank (2017) World Bank Open Data. Available from
: https://data.worldbank.org/The analysis illustrates that there is a relationship between increases in Malaysian GDP per
capita and export values, particularly from the start of the 1990s when the Penang FTZs and
Industrial Estates began to move from simple assembly functions to higher value added
component manufacturing and R&D activities.
0
50
100
150
200
250
300
1960
1962
1964
1966
1968
1970
1972
1974
1976
1978
1980
1982
1984
1986
1988
1990
1992
1994
1996
1998
2000
2002
2004
2006
2008
2010
2012
2014
2016
Malaysia-Export Values ($)
Bayan Lepas FTZ
0
2
4
6
8
10
12
14
16
Bayan Lepas FTZ


