


 93 / 235

Facilitating Smallholder Farmers’ Market Access
In the OIC Member Countries
83
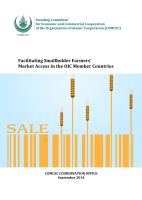
FIGURE 49: SIMPLE AVERAGE APPLIED MOST FAVORED NATION DUTIES FOR TURKEY AND THE
EUROPEAN UNION, 2011
Source:
World Tariff Profiles 2012 (WTO 2012).
Because of the Customs Union, Turkey’s average applied tariffs for non-agricultural goods
are equivalent to those of the EU. Primary agriculture remains outside of the Customs
Union, yet the EU and Turkey have largely identical tariff profiles for agriculture as well
(Figure 49), although tariff protection accounts for a larger share of protection in Turkey
than in the EU. Broadly speaking, the apparent differences in trade policies are largely due
to differences in applied rates for the horticulture, dairy, and livestock subsectors. More
specifically, tariff rates were much higher on average for dairy and animal products in
Turkey than in the EU. Smaller differences occur for horticultural goods, which both
Turkey and the EU produce. Finally, in contrast to the EU, Turkey has a significant tea
sector, which receives protection from imports.
141
141
Turkey produced just under 5 percent of world production in 2011.