


 17 / 206

Improving Agricultural Statistics in the COMCEC Region
5
land. COMCEC Members’ agricultural area share in total land area is higher than the world
average of 38 percent (Table 2)
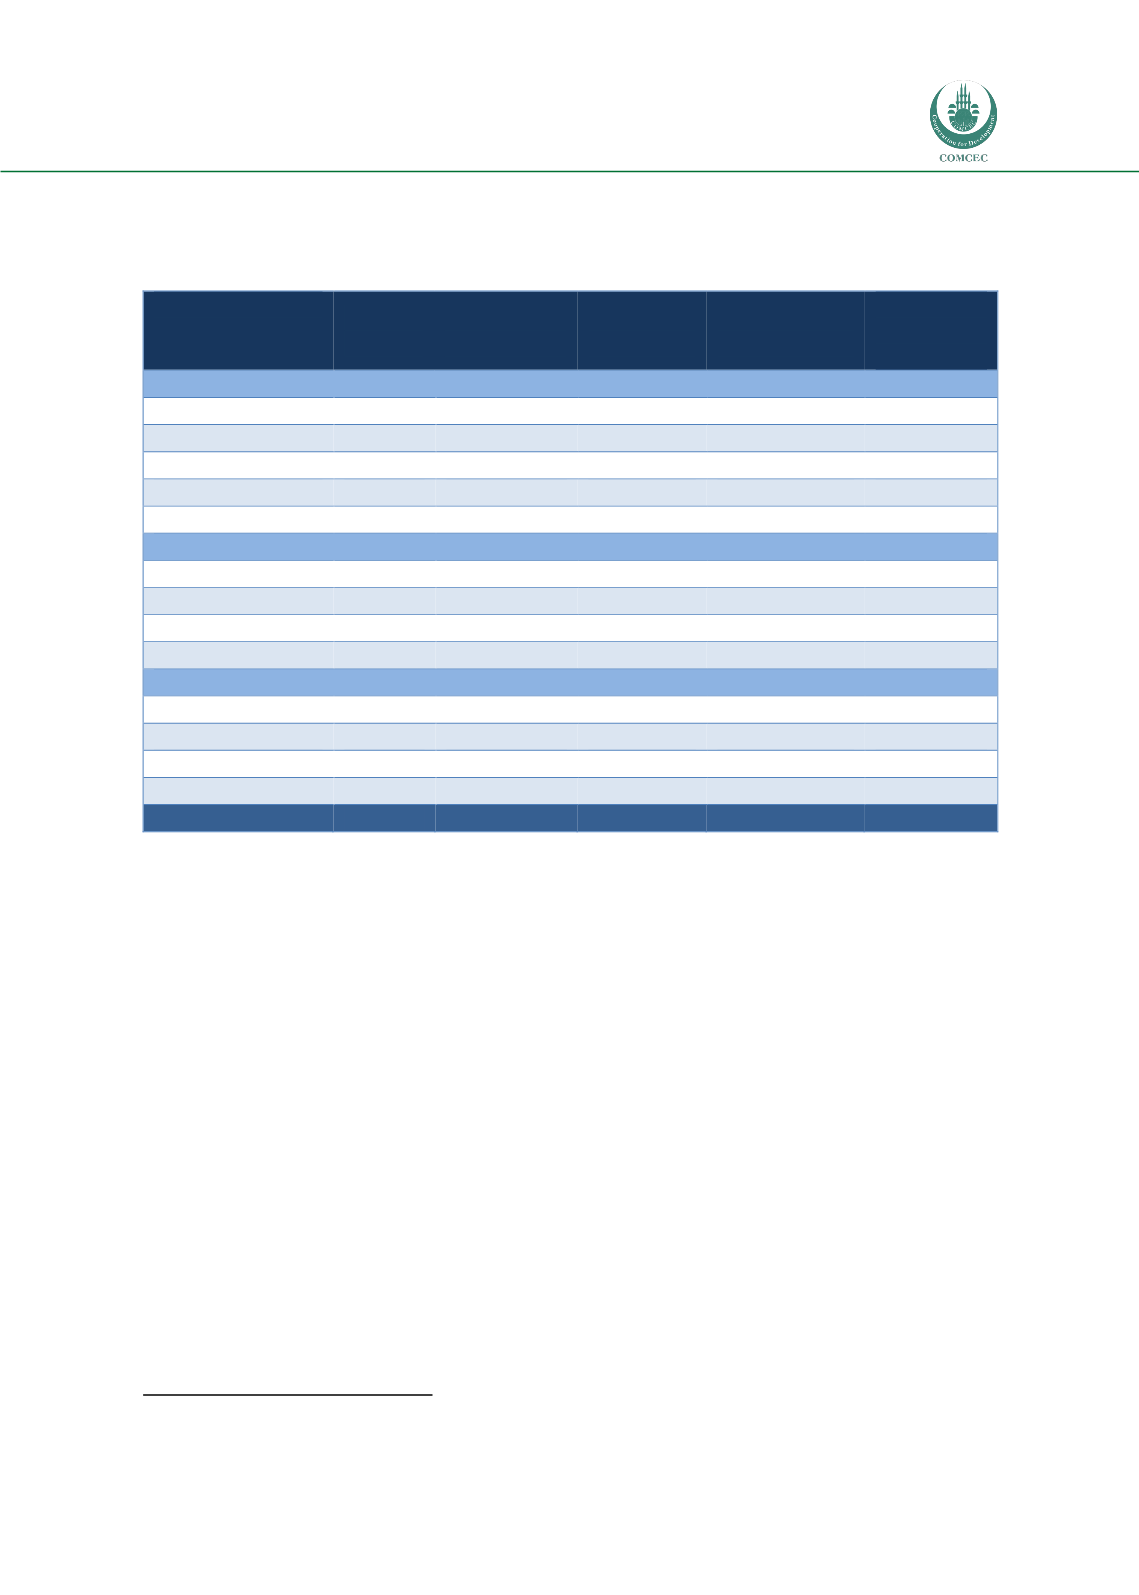
Table 2: Land Use in OIC Member Countries in 2011
Land
Area
Agricultural
Area
Arable
Land
Permanent
Crops
Meadows
and
Pastures
As % of World Total
African Group
9.1
11.3
8.7
8.9
12.4
Arab Group
8.6
7.9
3.9
6.3
9.2
Asian Group
6.8
9.8
8.4
20.6
9.4
OIC
24.5
28.9
21.0
35.9
31.1
World
100
100
100
100
100
As % of OIC Total
African Group
24.1
25.3
35.3
24.4
23.2
Arab Group
43.1
37.4
18.7
14.6
43.6
Asian Group
32.9
37.3
46.0
61.0
33.2
OIC
100
100
100
100
100
As % of Agricultural Area
African Group
-
100
34.1
3.8
116.3
Arab Group
-
100
10.1
1.8
58.2
Asian Group
-
100
22.1
6.6
65.9
OIC
-
100
20.7
3.9
73.5
World
-
100
28.4
3.1
68.4
Source: COMCEC, 2013.
The COMCEC Member Countries have a wide range of crop and livestock production systems
as they are in different agro-ecological zones, have different agricultural infrastructures as well
as production and consumption habits. Hence, a large variety of agricultural products are
grown in the COMCEC Region as a whole, with different yields depending on the levels of
mechanization, and use of other agricultural inputs, as well as climatic conditions.
In terms of the volume of agricultural production, as of 2011, COMCEC Member Countries
produced 15 percent of the world’s total cereals, 19 percent of fruits, 15 percent of vegetables
and 12 percent of meat.
6
While the number of undernourished people has been decreasing at the global level for the
period of 1990-2012, Sub-Saharan Africa, Northern Africa and Western Asia, where many
COMCEC Member Countries are located, are regions where undernourishment has increased.
The number of undernourished people in the COMCEC Region decreased from 194 million in
1990-1992 to 179 million in 2005-2007, in parallel with the global trend. More recently in
2010-2012, however, this figure increased to 185 million. In summary, over the last two
decades, the share of undernourished people in the COMCEC Region decreased from 18
6
COMCEC, 2013.